Demand Planning

-
Demand Planning
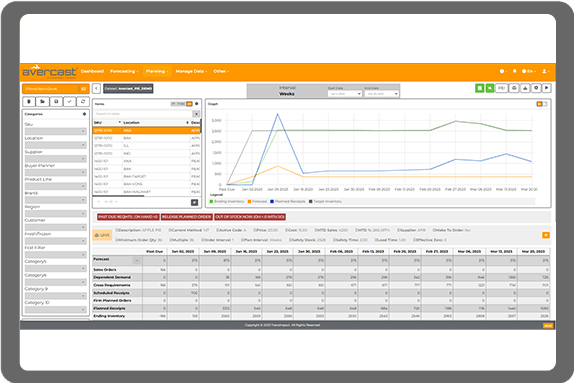
Demand Planning Software allows companies like yours to forecast upcoming demand for a product and plan inventory accordingly. Sometimes referred to as business forecasting software, this solution helps your company avoid unproductive stocking. Using demand forecasting for your supply chain, you can reduce inventory costs, and, in turn deliver excellent customer satisfaction.
Supply Planning

-
Supply Planning
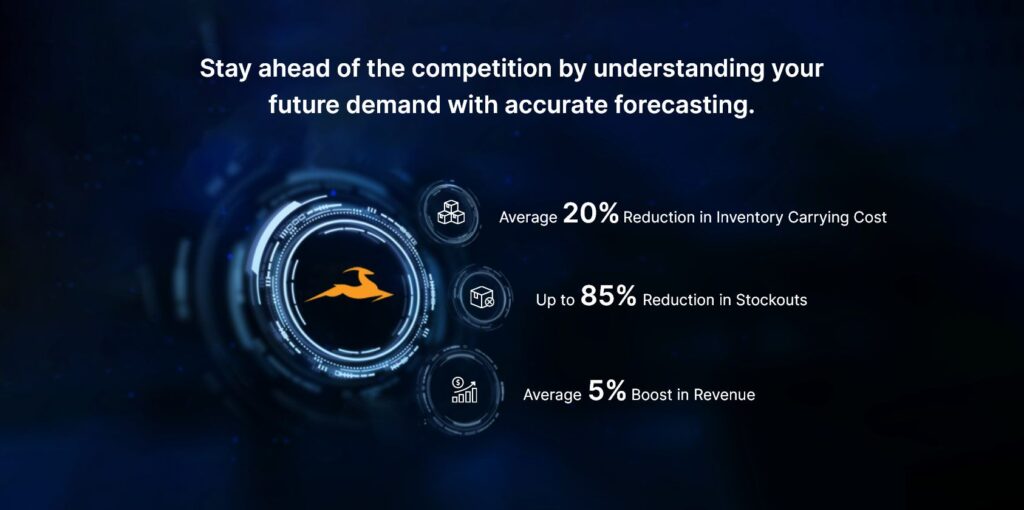
Our demand planning and forecasting software products are powered by 280+ advanced statistical algorithms and utilize ML (machine learning). Robust and accurate, Avercast products are easy to use and fast to implement, letting you identify opportunities and risks to make changes across the organization that lead to increased margins and
improved EBITDA.
Sales and Operations Planning

-
Sales and Operations Planning
Always know what inventory you need with Sales and Operations Planning Software. Plan for “what if” scenarios and optimize your demand planning. Build customized reports that fit your business needs. Align your sales and Operations with real-time updates using
S&OP software.
Business Intelligence

-
Business Intelligence
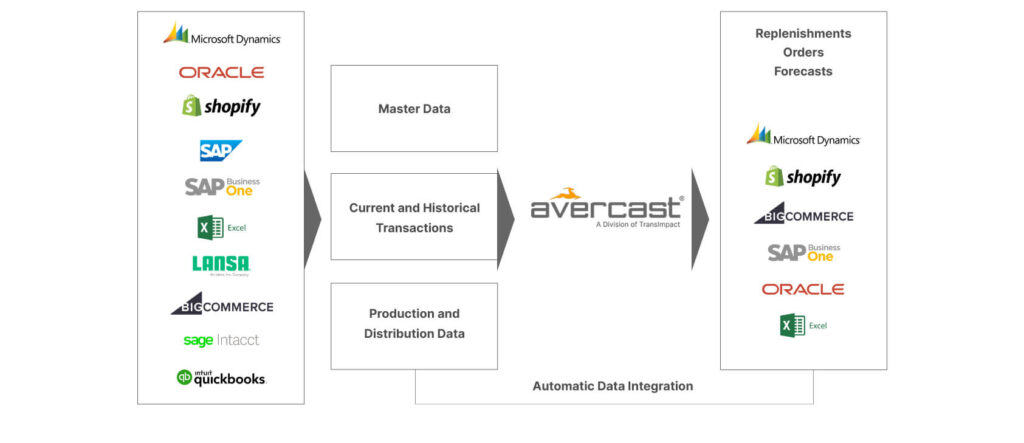
Powerful Business Intelligence analytics allow you to merge disparate systems, combining data and eliminating data silos for maximum efficiency and visibility. In just three to five clicks, we will help you pinpoint financial KPIs, EBITDA, operational and expense reporting, and streamline your data tracking
and management.